Field data for utility and telecom construction
As-built,
as it happens.
Crews record what they built. The office turns it into the record the client will accept. Offline on the truck, checked as it is drawn, exported in the format the contract asks for.
Our own crews use DatumPro on live jobs.
- Built with DatumPro in the field
- Comcast
- Networks our crews have worked on
- AT&T
- Spectrum
- C Spire

- Online or not, every map edit is saved on the device first and synced in order.
- The tool rail holds only the tools in this project’s catalogue.
- Each job has its own area. Share one job and that crew sees features only inside it.
Three things go wrong between the field and the deliverable. None of them are fixed by asking crews to be more careful.
- 1.
The data comes back wrong
Missing attributes, a line that connects to nothing, a feature type somebody invented on the day. It is found weeks later, by the person assembling the deliverable.
Rules are authored once and applied as the edit is made. For a few geometry mistakes, the strictest setting refuses the edit.
- 2.
The configuration lives in one person’s head
What counts as a valid drop, which attributes the client insists on, what may connect to what — carried by whoever has been there longest.
Catalog Studio makes it an artifact: tools, attributes, connections, visuals and quality rules, used live by each project.
- 3.
The deliverable is rebuilt by hand
The map says one thing, the spreadsheet another, and somebody spends two days reconciling them into a plan set nobody trusts.
Reports and map books are produced from the same records the crew collected — the same numbers every time.
Six parts, one record. Start with the map and add the rest as the work needs it.
- A map that works where the signal does notCrews draw on a map that keeps working without signal; every map edit is saved on the device and synced in order.
- Configure the job once, in Catalog StudioCatalog Studio sets what crews can draw, what each feature must carry, and what may connect to what.
- Problems caught while they are drawnQuality rules check each edit as it is made; for three geometry mistakes, the strictest setting refuses the edit.
- Work orders with the fields you trackWork and work items carry the fields your organisation tracks; each client keeps its own labor codes and prices.
- Exports the client will actually acceptReports, spreadsheets, KMZ and a PDF map book, produced from the records the crew collected.
- Access that follows the work, not the org chartRoles are granted to people and teams at a scope, and the server checks them before it hands over map data.
The deliverable comes out of the same records. Nobody rebuilds it by hand.
- A PDF map book at a fixed scale: an overview, then a detail sheet wherever work has been drawn, with an index when there is more than one.
- Reports over your own fields, as CSV or XLSX, with dates, decimals and units in the reader’s format.
- KMZ for anyone who opens the work in a mapping tool.
Turn the live map into the deliverable: a report, a spreadsheet, or a georeferenced PDF map book.
Orange is where DatumPro started. Every other colour is a catalogue you build.
The colours are the APWA locate code — the paint on the ground above a buried line. DatumPro ships starter catalogues for communication lines. For any other utility, you describe your network in Catalog Studio.
- OrangeStarter catalogues
- Communication, alarm and signal lines, cables and conduit
- Red
- Electric power lines, cables, conduit and lighting cables
- Yellow
- Gas, oil, steam, petroleum and other gaseous or flammable material
- Blue
- Potable water
- Green
- Sewers and drain lines
- Purple
- Reclaimed water, irrigation and slurry lines
- Pink
- Temporary survey markings
- White
- Proposed excavation
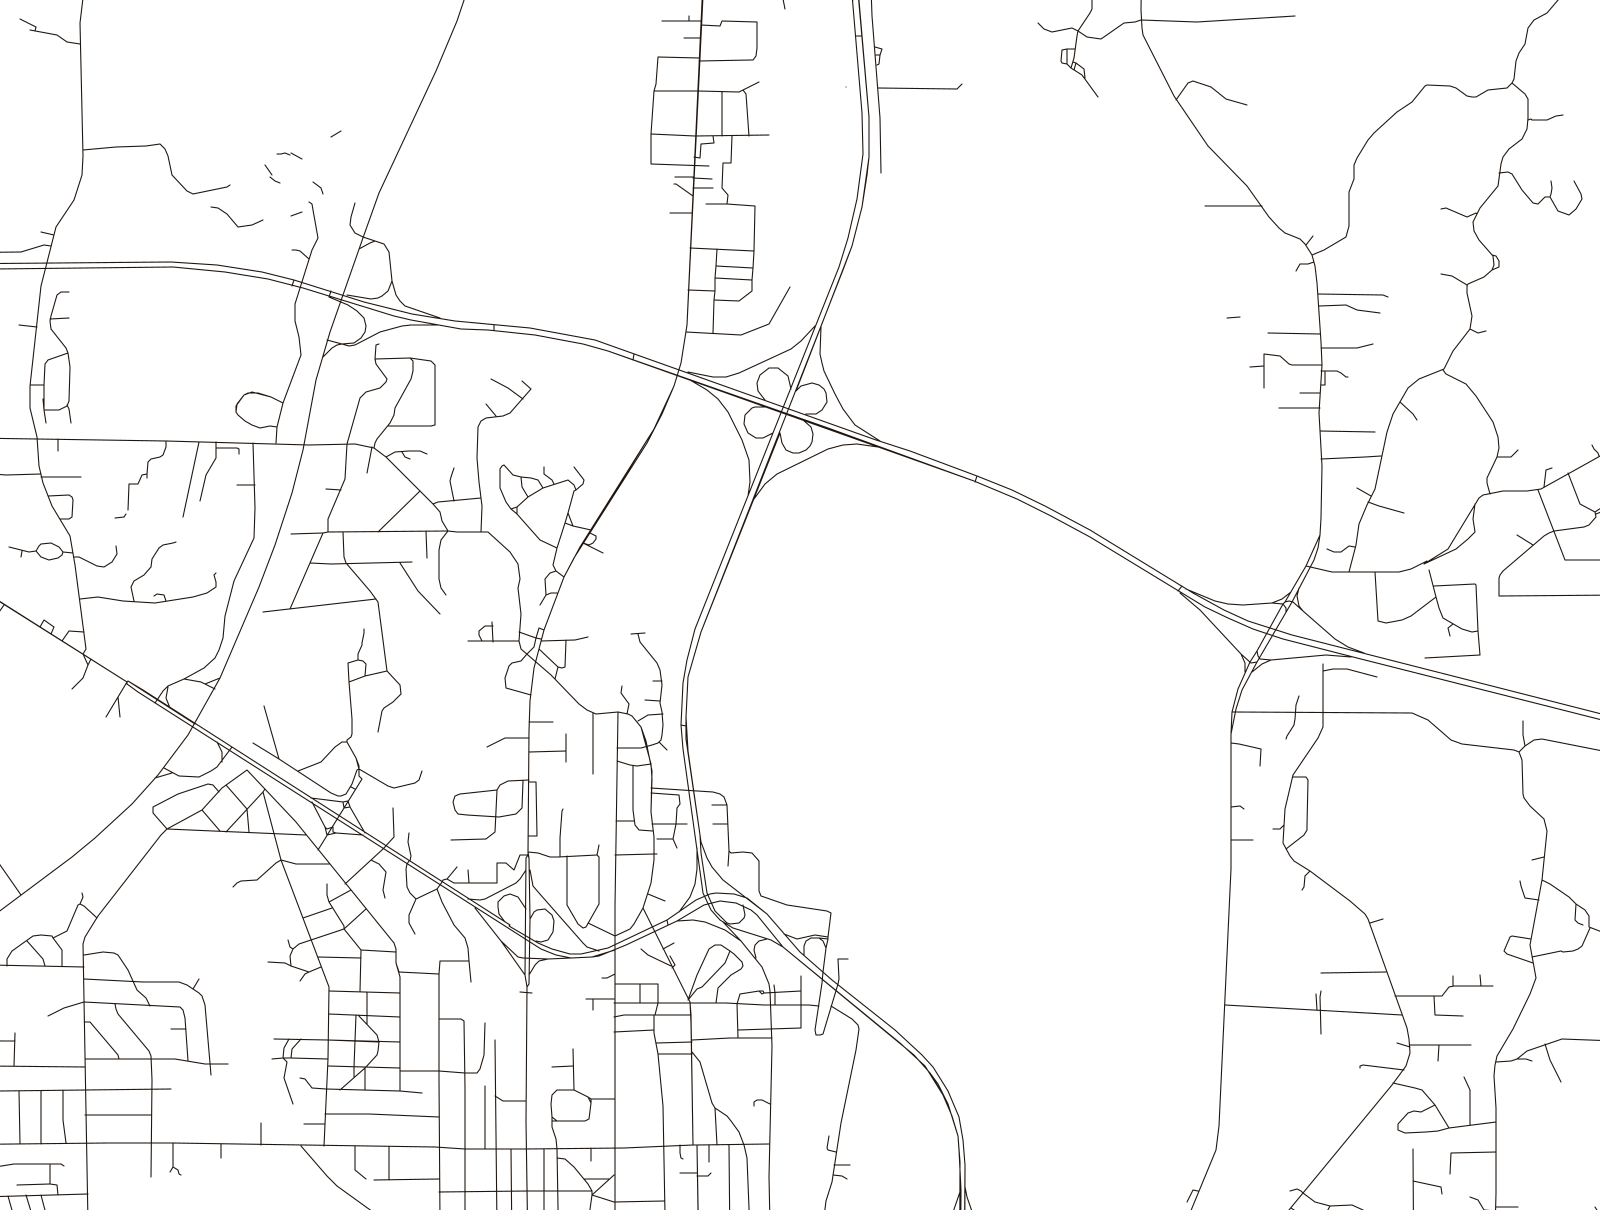
Base: street centre lines of north Tupelo, Mississippi, from U.S. Census Bureau TIGER/Line 2024 (public domain).
See it against your own build
A demo runs on your data shape: your tools, your attributes, one of your projects. Thirty minutes, no slide deck.